Product managers (PMs) know that teaching new users the basics of their product is a key outcome for onboarding, but customer success is about more than orienting users to your app’s navigation. You need to highlight the right features–the ones that best demonstrate your product’s value–and convert new users to returning users.
Many people talk about “aha moments” or “user activation” when trying to understand what makes onboarding stick. At Pendo, we use Core Events to support qualitative concepts like “aha moments” with quantitative data. This helps our customers understand and identify the parts of their products that drive successful onboarding and contribute to long-term outcomes like retention.
High retention rates are essential for efficient growth (especially in scaling organizations), and product teams can support revenue growth by designing onboarding experiences that maximize retention. Core Events let you visualize which features correlate with higher account retention, as well as how long it takes new users to discover those features. Once you identify and understand your Core Events, you’ll be able to optimize your onboarding for the outcomes that matter the most.
What are your product’s Core Events?
In Pendo, you can flag up to ten Core Events in each unique application, and these can be any combination of page, feature, or track events. This limit forces teams to think critically about which areas of the product matter the most for a customer’s long-term success. To begin identifying your product’s Core Events, start with your product’s value proposition. If your organization subscribes to the Jobs To Be Done (JTBD) framework, what is the JTBD (or JTBDs) that a user should do first? What is the workflow a user must complete to realize value from your product?
Next, outline the steps or tasks a user needs to complete in order to realize that Job To Be Done. The best candidates for Core Events are “terminal actions” that indicate that the user has completed a workflow, or better yet, achieved a valuable outcome. For example, a valuable action in our product is when users “Save Report” or “Publish Report.” This is more indicative of the desired outcome of users sharing insights from Pendo than if we measured engagement with the “Create New Report” button.
You likely have some obvious Core Event candidates, but if you need inspiration, consider looking at the features most commonly used by your NPS promoters or features users often highlight as their favorites. Identifying Core Events is not an exact science, but rather a project that requires both product data and healthy internal debate. In other words, you can’t just pick your most-used features (in many products, this would include an over-representation of navigation elements). Product teams need to narrow in on the features that drive key user outcomes, which requires critical thinking, user empathy, and validation with quantitative data.
Using data to validate your Core Events
Now that you’ve identified some candidates, it’s time to validate them as Core Events. A key quality of Core Events is that users of a Core Event have higher retention rates than your average users. Here’s how to explore the data and see which events meet that criteria:
Start by finding your baseline average retention. The Retention by Account report in Pendo’s Behavior tab will show you a detailed breakdown of your retention rates for various cohorts. In the example below, the average retention for all users at three months is 53%.
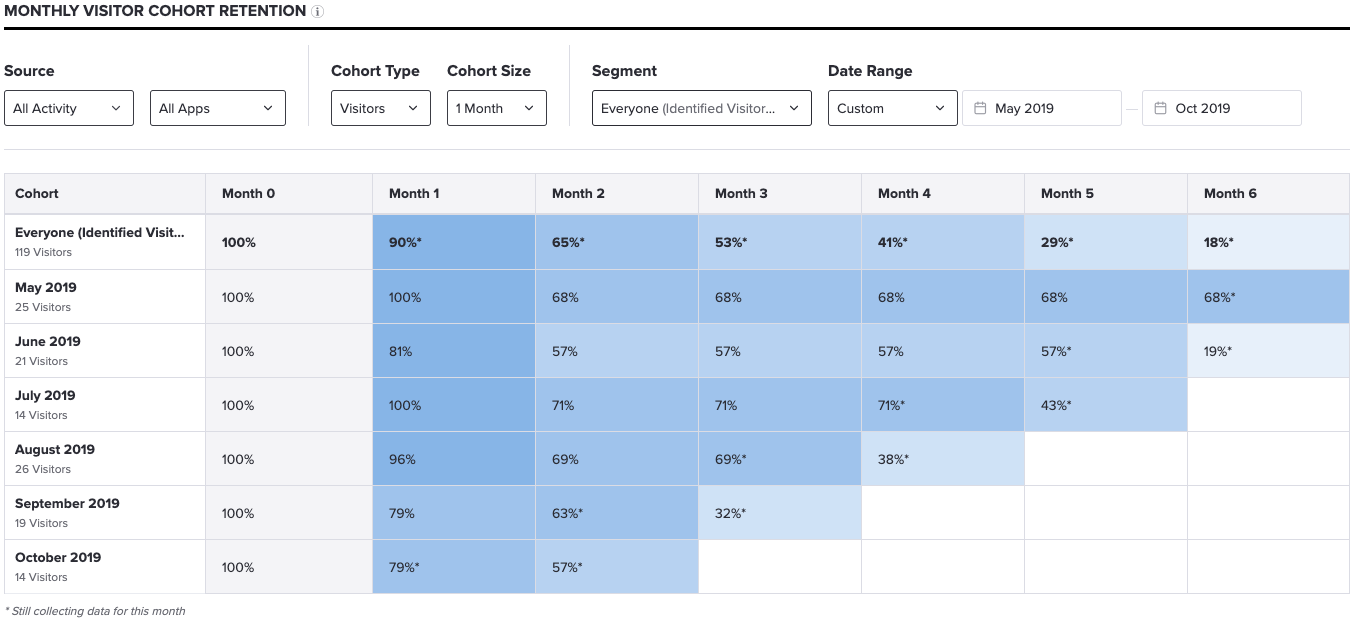
The Retention by Account report will provide your average retention. This chart shows us that our average retention at 3 months is 53%.
Using the Account Retention widget, look at the retention rates of accounts when a given Core Event is used early in their user journey. The chart below shows the retention rate for accounts who use a given Core Event in their first 30 days. It also includes a “control line” that shows average monthly retention rates for all users. As a rule of thumb, features that have at least a 1.3X increase over baseline retention are strong candidates for Core Events.
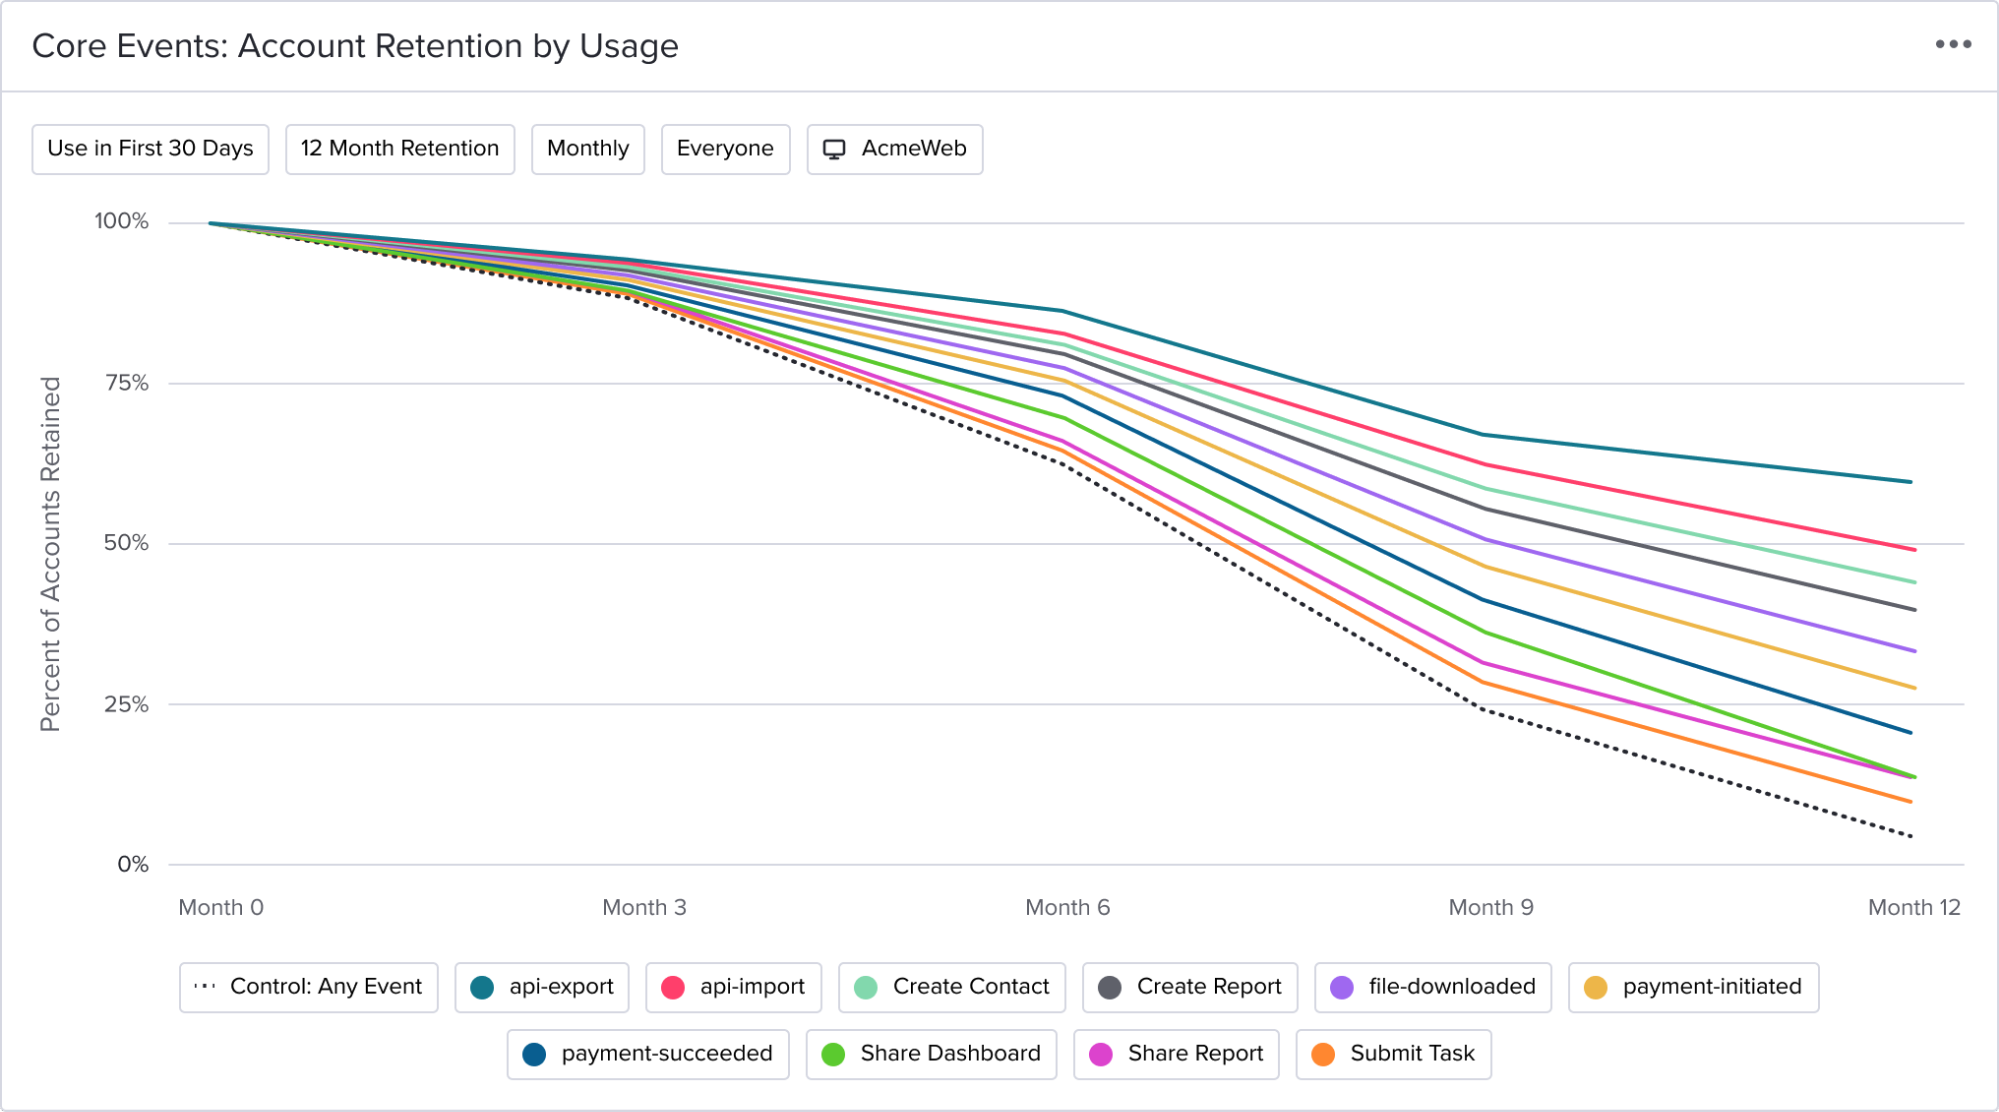
This chart lets us look at the impact of feature usage on retention, where the dotted line shows average retention for all users. Features that have at least 1.3X increase over baseline retention are strong candidates for Core Events.
Next, explore the overall usage and adoption of your Core Event candidates with the Time to First Use widget. This will show you the distribution of how quickly users first discover a particular feature. The default time window is 30 days from a user’s first login, or you can apply custom date ranges.
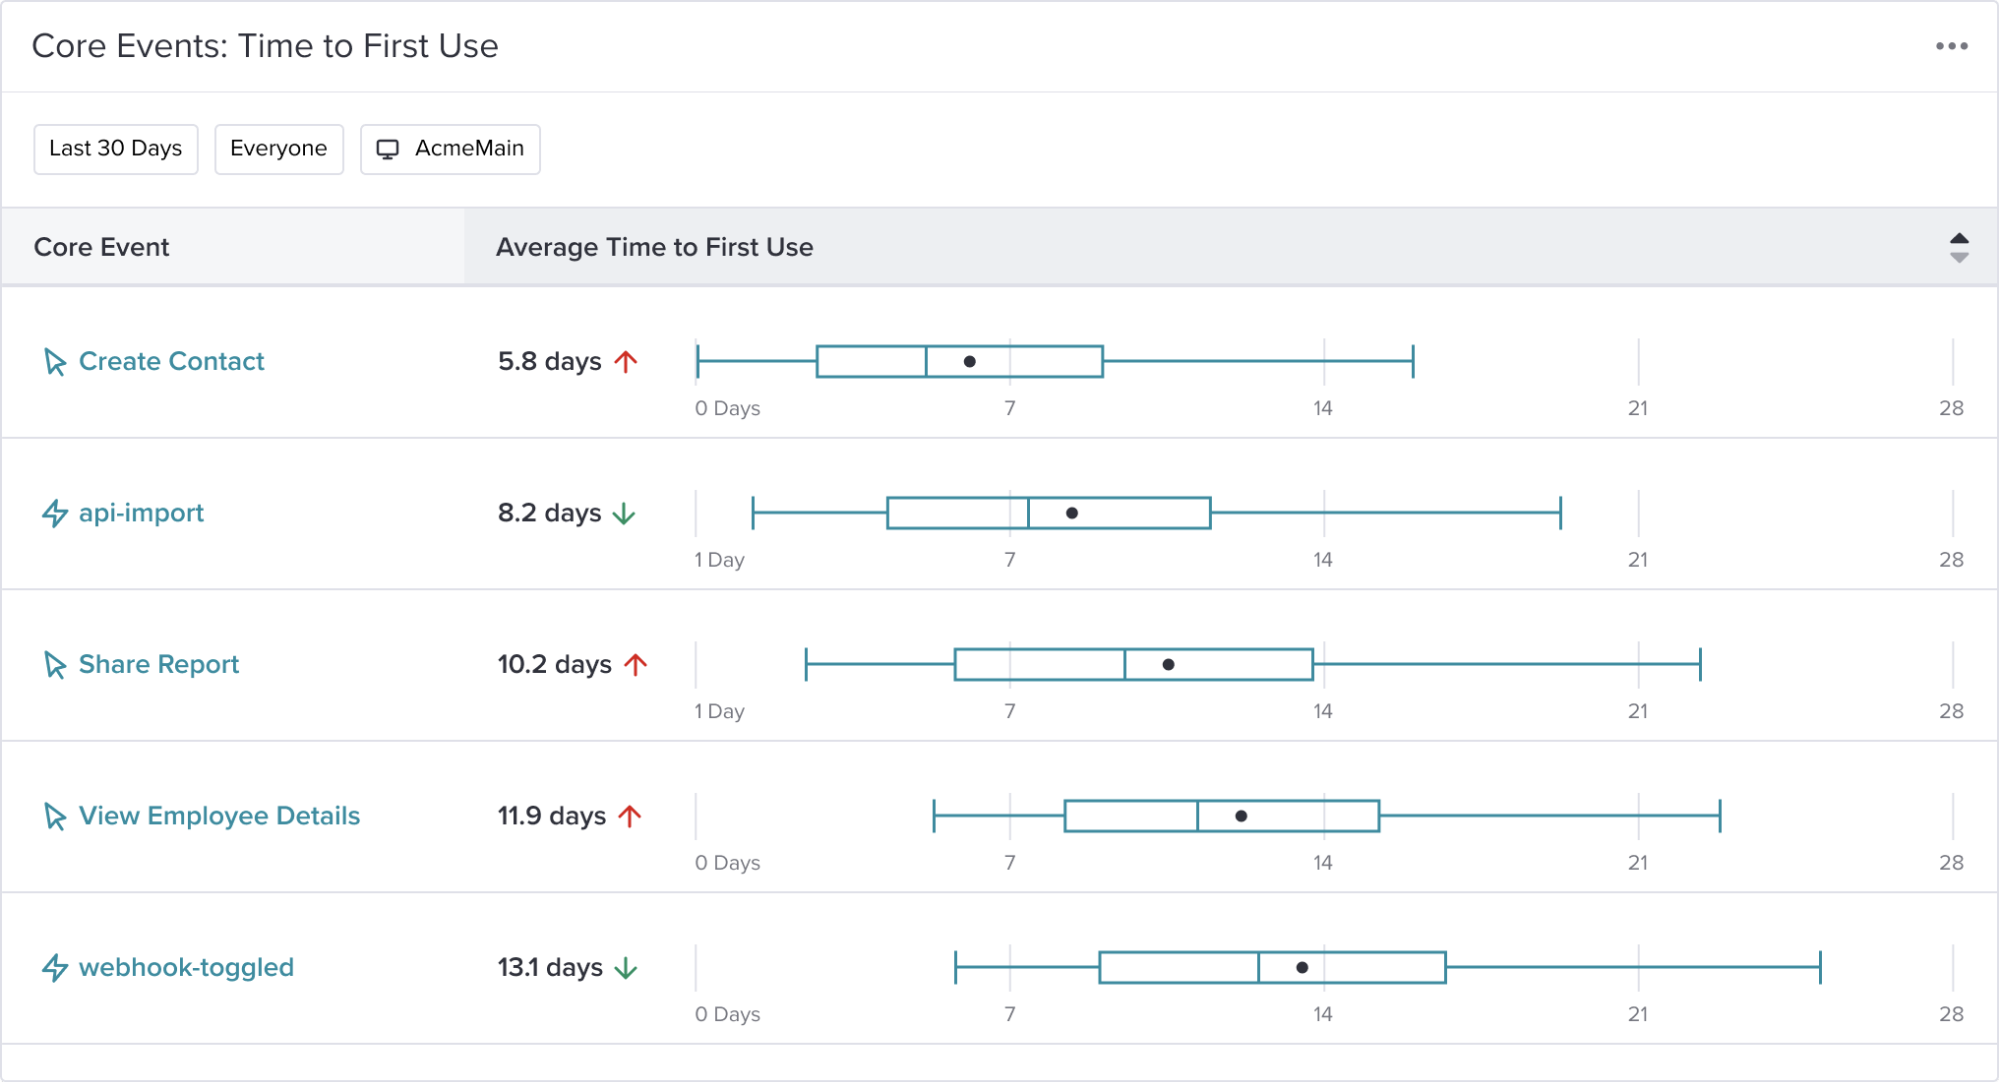
This chart shows us the distribution of how quickly users first discover each feature.
As you identify and validate your Core Events, it’s important to keep in mind that these should be features that correlate with high retention and have high levels of adoption. If a low number of users (e.g. less than 5%) ever discover and use a feature, it’s either not a Core Event or it might require a usability audit to understand how to drive better adoption.
What else can you learn from your Core Events?
Once you have identified your set of Core Events, there are a number of ways to explore this data and uncover insights that will help you optimize onboarding. You might start by asking questions like:
-
- Of our Core Events, which takes the longest for users to find? Why?
- For our Core Event that drives the highest retention, what percentage of users discover this feature in the first 30-60-90 days? How might we improve this?
- How do different segments of users discover Core Events differently?
Exploring segments can be especially powerful. Start by identifying a positive business outcome (like renewal, expansion, or high NPS) and create segments for users who do and don’t achieve that outcome. You could also look at behaviors of users with different permissions, or how free and paid users experience your product differently. By applying those segments to the Time to First Use visualization, you’ll be able to uncover variations in behaviors and see which Core Events contribute to positive customer outcomes.
For example, one of our customers noticed that free trial users were less likely to convert if they submitted multiple support tickets during their trial. Using a segment of “Has sent a support ticket > 5 times,” they noticed that high-volume ticket creators took 20-80 days to discover a key Core Event. In contrast, users with low ticket creation (and higher conversion rates) found the Core Event in the first two days. Now, the team is building in-app guides to drive awareness of this Core Event and are monitoring to see if support requests go down and conversions go up.
Core Events can also be used as customer health indicators or onboarding milestones. You might leverage Pendo’s Salesforce integration to surface this information in the dashboards your customer team uses to monitor their accounts. Or, use a Visitor Report to identify low Core Event usage after 30 days, and automatically trigger alerts via Zapier.
The future of Core Events
We’ve designed this first application of Core Events as a powerful way to uncover which user actions in your product are most likely to increase retention. Because you can design onboarding to highlight any arbitrary features, using Core Events helps you focus on the features that matter. It’s also a powerful way to ensure your team is allocating resources to the right product areas, and can help inform roadmap planning and prioritization.
Future use cases will include adding context on how the amount or frequency of use of a Core Event contributes to specific customer outcomes, and using Core Events to quantify product engagement. In the meantime, you can visit our help documentation to learn how to set up Core Events and how to interpret the Core Event widgets.