75% of software companies see minimal change to product usage during COVID-19 crisis
This is the first in a series of posts on the impact of the COVID-19 crisis on software product usage across 40+ industries and sub-industries, based on an analysis of anonymized product usage data. Pendo will update the data weekly, with fresh analysis on emerging trends.
I’d like to thank Alex Rosenbower on our data science team for partnering on this analysis and building these visualizations.
With millions of people around the world conducting every aspect of life and work at home, the global COVID-19 crisis has forced technology use like few events in history.
Pendo has a unique vantage point on today’s crisis—we help more than 1,400 companies around the world understand how their software applications are being used and provide tools for product teams to enhance the experience. Our data science team has been hard at work analyzing anonymized product usage and we’re making it available so others can monitor emerging trends in software usage too.
Impact of COVID-19 crisis on product usage growth
We’ll kick it off with a series of pie charts that show the percentage of businesses across the full set of data that are seeing product usage accelerate, stay roughly the same, slow or decline. See definitions of these categories here.
Here are three key findings:
1. Product usage is normalizing for a vast majority of companies. As of April 20, 75% of companies saw product usage return to a normal range. That’s up from only 34% that experienced minimal impact the week many states and nations implemented stay-at-home orders. It appears that many of us are settling back into the tools we used previously, with perhaps a brief disruption while we adjusted to a new normal.
2. Fewer companies are seeing dramatic declines in usage. While 43% of companies saw an abrupt drop in usage as schools and businesses closed or went remote, just 9% of companies continue to experience significant declines, and 11% are seeing usage slow. Those are predominantly in industries that continue at a near standstill since the crisis began—sports, hospitality, and events to name a few. We expect our data to show early signs of activity in these industries—we’ll see usage increase as people return to booking travel, participating in sports and fitness activities and planning events.
3. A small subset of software applications—just 5%—are experiencing large increases in usage. They represent sectors that are replacing in-person interactions like classroom learning, doctors’ visits, training and onboarding employees, and team collaboration. We will be monitoring these industries as stay-at-home orders lift to see if usage remains high, signifying long-term behavior changes.
Average weekly product usage change
In the charts below, we’ve provided a visualization of software usage across 13 key industries—grouped by positive and negative trend lines. And in five most-impacted categories, we’ve provided a deeper dive into sub-industries seeing significant usage gains or losses.
Healthcare
Key finding: Doctors’ offices slow to implement telemedicine are moving to it in droves—usage of telehealth platforms increased 63% in week two and has stayed significantly above the baseline since. Electronic health records are seeing the lowest usage in the health care category, as many doctor and dental offices remain closed or operating at reduced hours.
Education
Key finding: Schools accustomed to classroom learning are adopting platforms that enable a digital experience—usage of e-learning products continues to climb with a 145% in week six and may only taper once summer break kicks in.
Hospitality
Key finding: While some restaurants transitioned to a takeout-only model, many closed for business, resulting in 85% drops in usage of the software they use to run or market their businesses. Travel and hospitality follow a similar pattern but not at the same level of the restaurant industry.
Human Resources
Key finding: Many companies moved quickly to pull back on hiring as the world came to a halt in mid-March, and recruiting software usage dropped 39% at its lowest point. Now that businesses seem to have a better understanding of their priorities for the coming year, we’ve seen our first slight uptick in recruiting platform usage. Corporate training software, meanwhile, has becoming increasingly important as companies have adopted remote work.
Finance
Key finding: Banking platform usage spiked 41% over the last week—likely a combination of increases in loan applications as the PPP program rolled out and banks moving more of their offerings digital.
What do you find most interesting in the data? Please share your perspective by mentioning us on Twitter or tagging us on LinkedIn.
Methodology
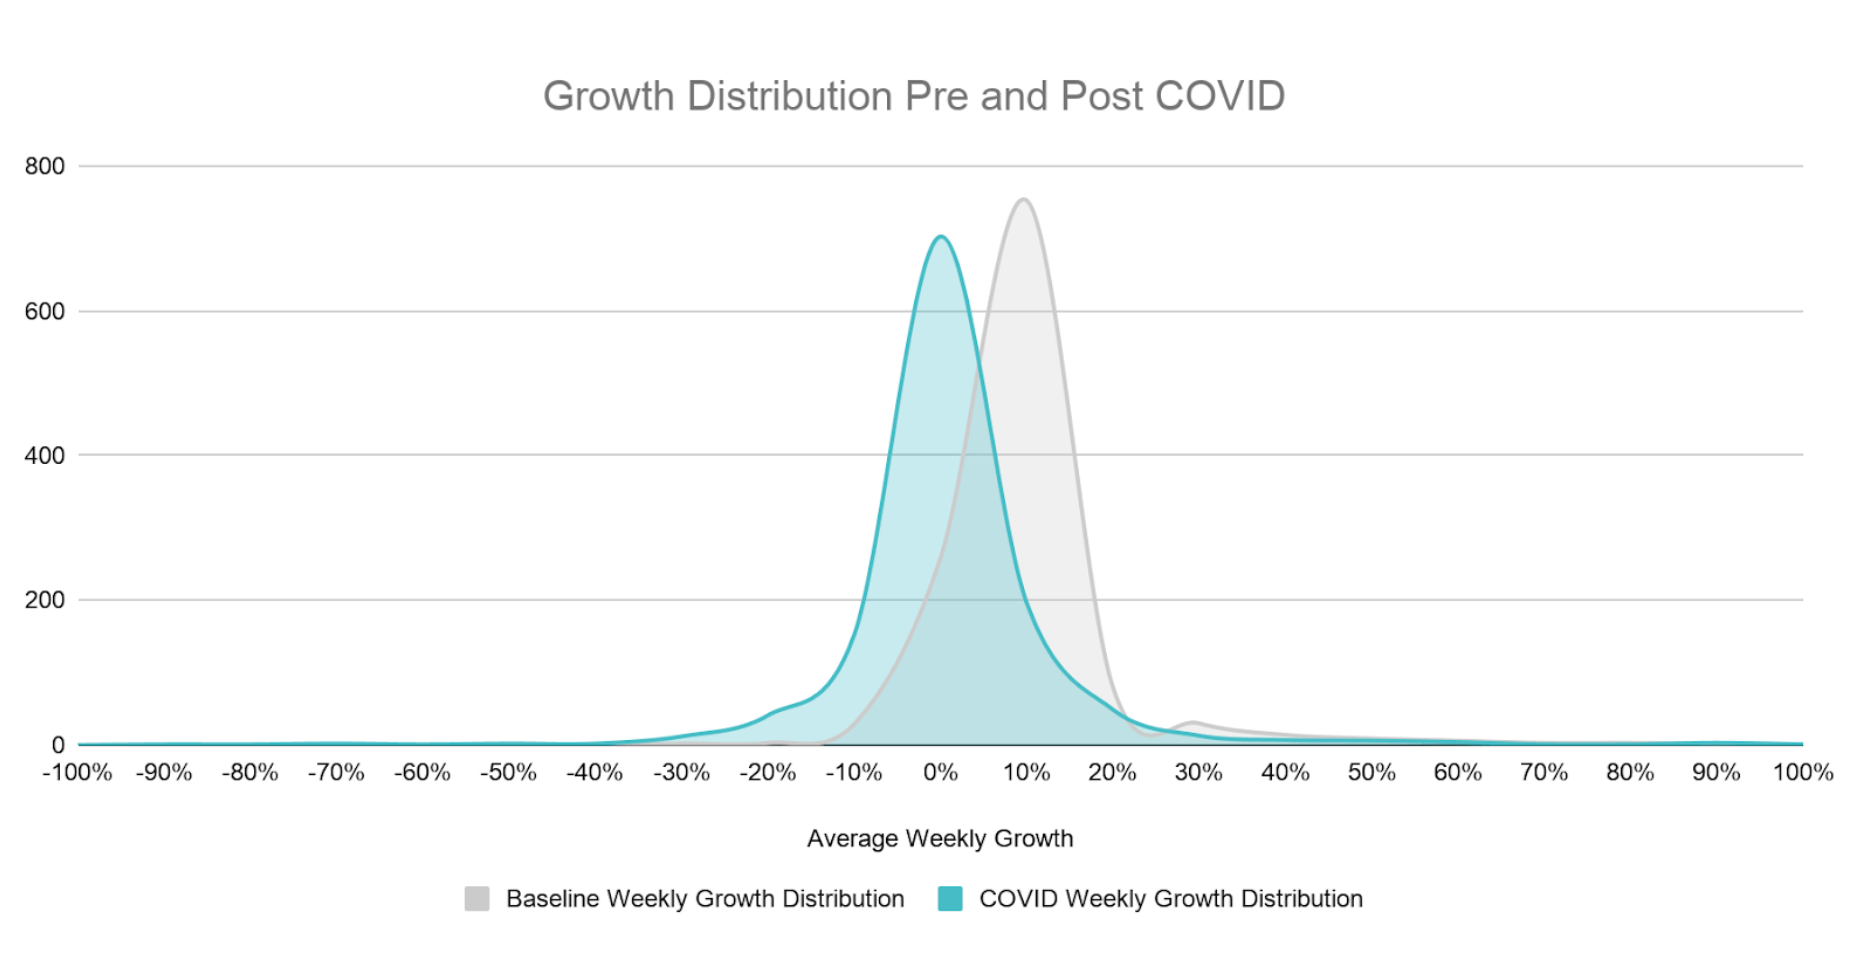
We gathered anonymized product usage data from a subset of Pendo customers and analyzed their average weekly growth during business days in the five weeks prior to the “COVID period” (2/3/20 – 3/6/20) to establish a baseline distribution of growth. We then updated average weekly growth during the COVID-19 period plotted against the baseline period. Products included in the analysis fall in one of the 40 industries, have at least 90 days of usage data and more than 10,000 average weekly events leading up to the COVID period to eliminate any outliers.
Growth category descriptions
The baseline average weekly growth of the customers fitting the criteria above is unweighted and represented in the gray distribution in the chart below. The standard deviation of growth during the baseline period was 12%. The distribution of growth during the COVID period is represented in the blue distribution and plotted along side the baseline period. The COVID period distribution is shifted to the left indicating slower growth during this period, overall.
Using the baseline distribution of growth, we established the following categories for how product usage has been impacted during the COVID period.
| Category | Description | Significance |
|---|---|---|
| Accelerating | Average growth during the COVID Period accelerating more than 15% | > 1.5 std dev above |
| Limited Impact | Average growth during the COVID Period was between -6% and 15% | +/- 1 std dev |
| Slowing | Average growth during the COVID Period decelerated between -7% and -12% | between 1 and 1.5 std dev below |
| Declining | Average growth during the COVID Period decelerated below -12% | > 1.5 std dev below |